

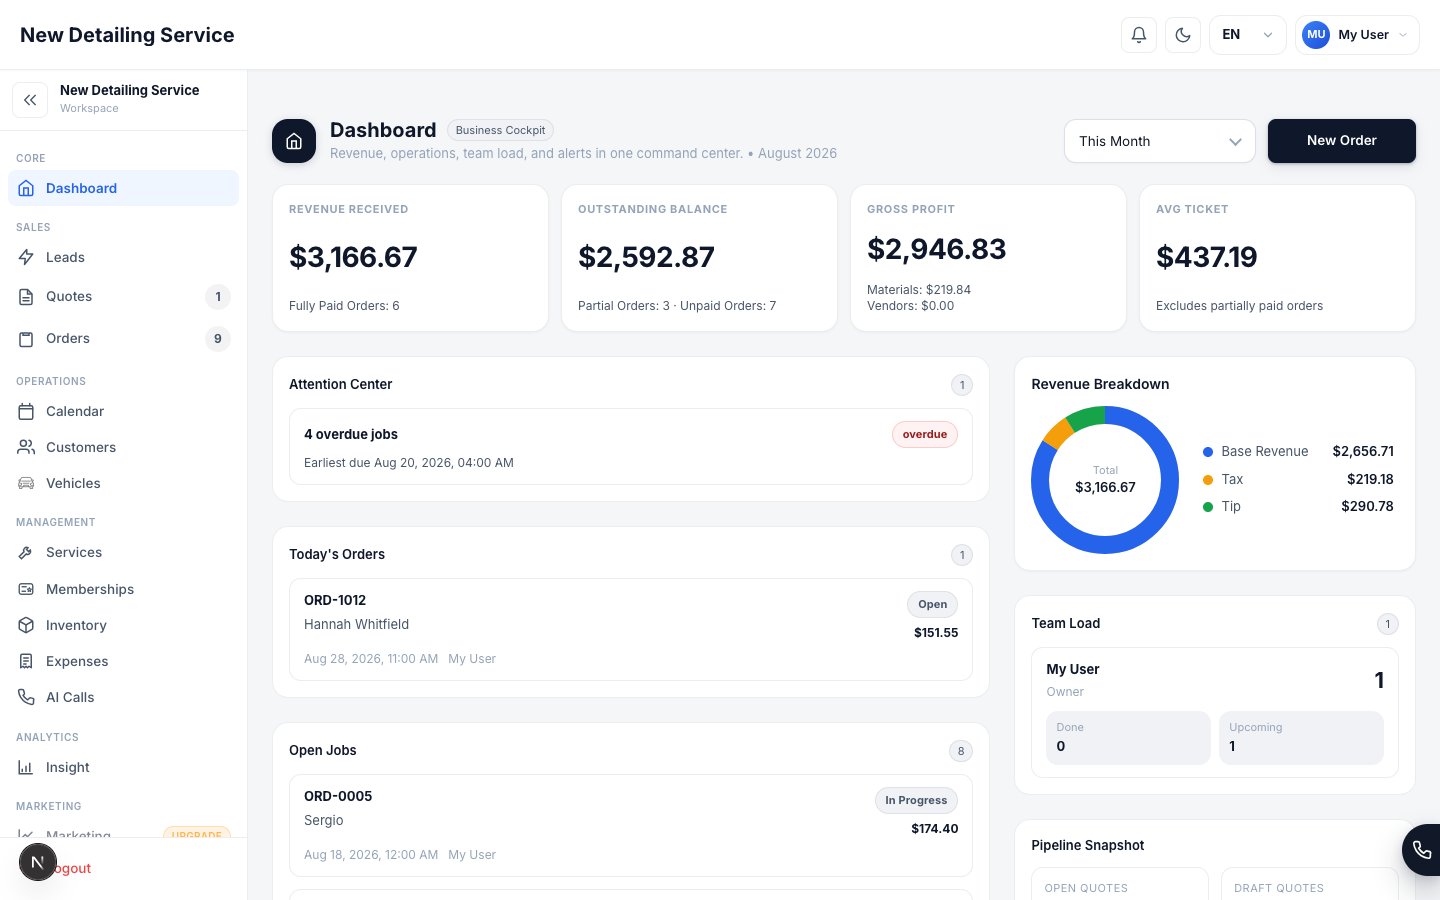
Three dashboard modes
The dashboard automatically shows the mode matching your role. Owners and admins can switch between Cockpit and Operations Console manually.
Business Cockpit
The Cockpit is the financial and operational nerve center. At the top you see four KPI cards for the selected period:Attention Center
The Attention Center highlights issues before they become problems. Each alert links directly to the affected record so you can act without searching:- Overdue orders — jobs past their due date, shown with severity badge and earliest due date
- Low stock items — inventory that has dropped below your configured minimum
- Unassigned orders — jobs without a staff member assigned
Revenue Breakdown
The donut chart to the right of Attention Center breaks your total revenue into three layers:- Base Revenue — service income before tax and tips
- Tax — tax collected across all orders in the period
- Tip — tips recorded on orders
Team Load
Shows each staff member’s assigned orders for the selected period with a count of completed vs. remaining. An empty Team Load panel means no orders are assigned yet — a useful early warning for scheduling gaps.Pipeline Snapshot
Displays active work-in-progress across the sales funnel:- Open Quotes — estimates waiting for customer approval
- Draft Quotes — quotes your team is still preparing
- New Leads — inbound inquiries not yet followed up
- Public Leads — leads from your website or booking page
Operations Console
Built for the person coordinating daily work rather than reviewing financials. The Operations Console surfaces:- Today’s Orders — what’s scheduled for today, with status and assignment
- Open Jobs — all orders created but not yet started, regardless of scheduled date
- Recent Done Jobs — completions from the last 24–48 hours
My Day
My Day is the technician view. It strips out everything that doesn’t apply to the individual and shows:- My Schedule — your shift start and end time for today
- My Assigned Orders — jobs assigned to you, in scheduled order
- My Open Jobs — anything assigned to you that hasn’t been completed
Changing the reporting period
The period selector in the top-right of the Cockpit controls which time window the KPI cards and Revenue Breakdown reflect. Available options include:- This Month — current calendar month
- This Year — full calendar year to date
- All Time — every order in the workspace
Orders
Manage the jobs your dashboard is tracking.
Insights
Go deeper with 11 report types: P&L, staff performance, body type breakdown, and more.
Calendar
See your team’s schedule alongside dashboard data.
Inventory
Manage the stock items that trigger low-stock dashboard alerts.